In this blog post, I (Damien Ringeisen) reshape a Twitter thread that I published on November 3rd, 2021.
Today, as the COP26 started a few days ago, I would like to help you visualize the reduction of sea ice in the Arctic Ocean.
For simplicity, we will compare two years:
- 1979, the first year with satellite observations of sea ice.
- 2021, the present year.
And we will look at the sea ice conditions at the September sea ice minimum extent: Each year in September, there is a day when the area covered by sea ice is minimum. It is the day when sea ice, globally, stops melting and starts to freeze again.
For this data, we will look at the data from the NSIDC. They indicate that the minimum extent was
- on Sept 16, 1979, with 6.90 million square kilometer
- on Sept 22, 2021, with 4.72 million square kilometer
But sea ice extent is not the only data we want to visualize. Let’s get the estimation of the sea ice volume from PIOMAS. (We already used PIOMAS data set in The Arctic Stripes )
From PIOMAS, we get the arctic sea ice volume on the same dates
- 16.86 thousand cubic kilometers on Sept 16, 1979
- 4.77 thousand cubic kilometers on Sept 22, 2021
Now that we have the data, let’s draw ice cubes: For each date, we draw an ice cube with:
- a base of the size of the sea ice extent, as a square.
- the volume of the sea ice volume.
- Thus, the height of the cube is the average thickness of sea ice on that date
Of course, we cannot draw horizontal and vertical dimensions at the same scale; otherwise, one would need a screen the size of the Arctic ocean to visualize it.
So we exaggerate the vertical dimension.
However, we draw both ice cubes at the same scale so we can compare them.
Et voilà!
An ice cube comparison of sea ice extent and volume at the minimum sea ice extent of 1979 and 2021:
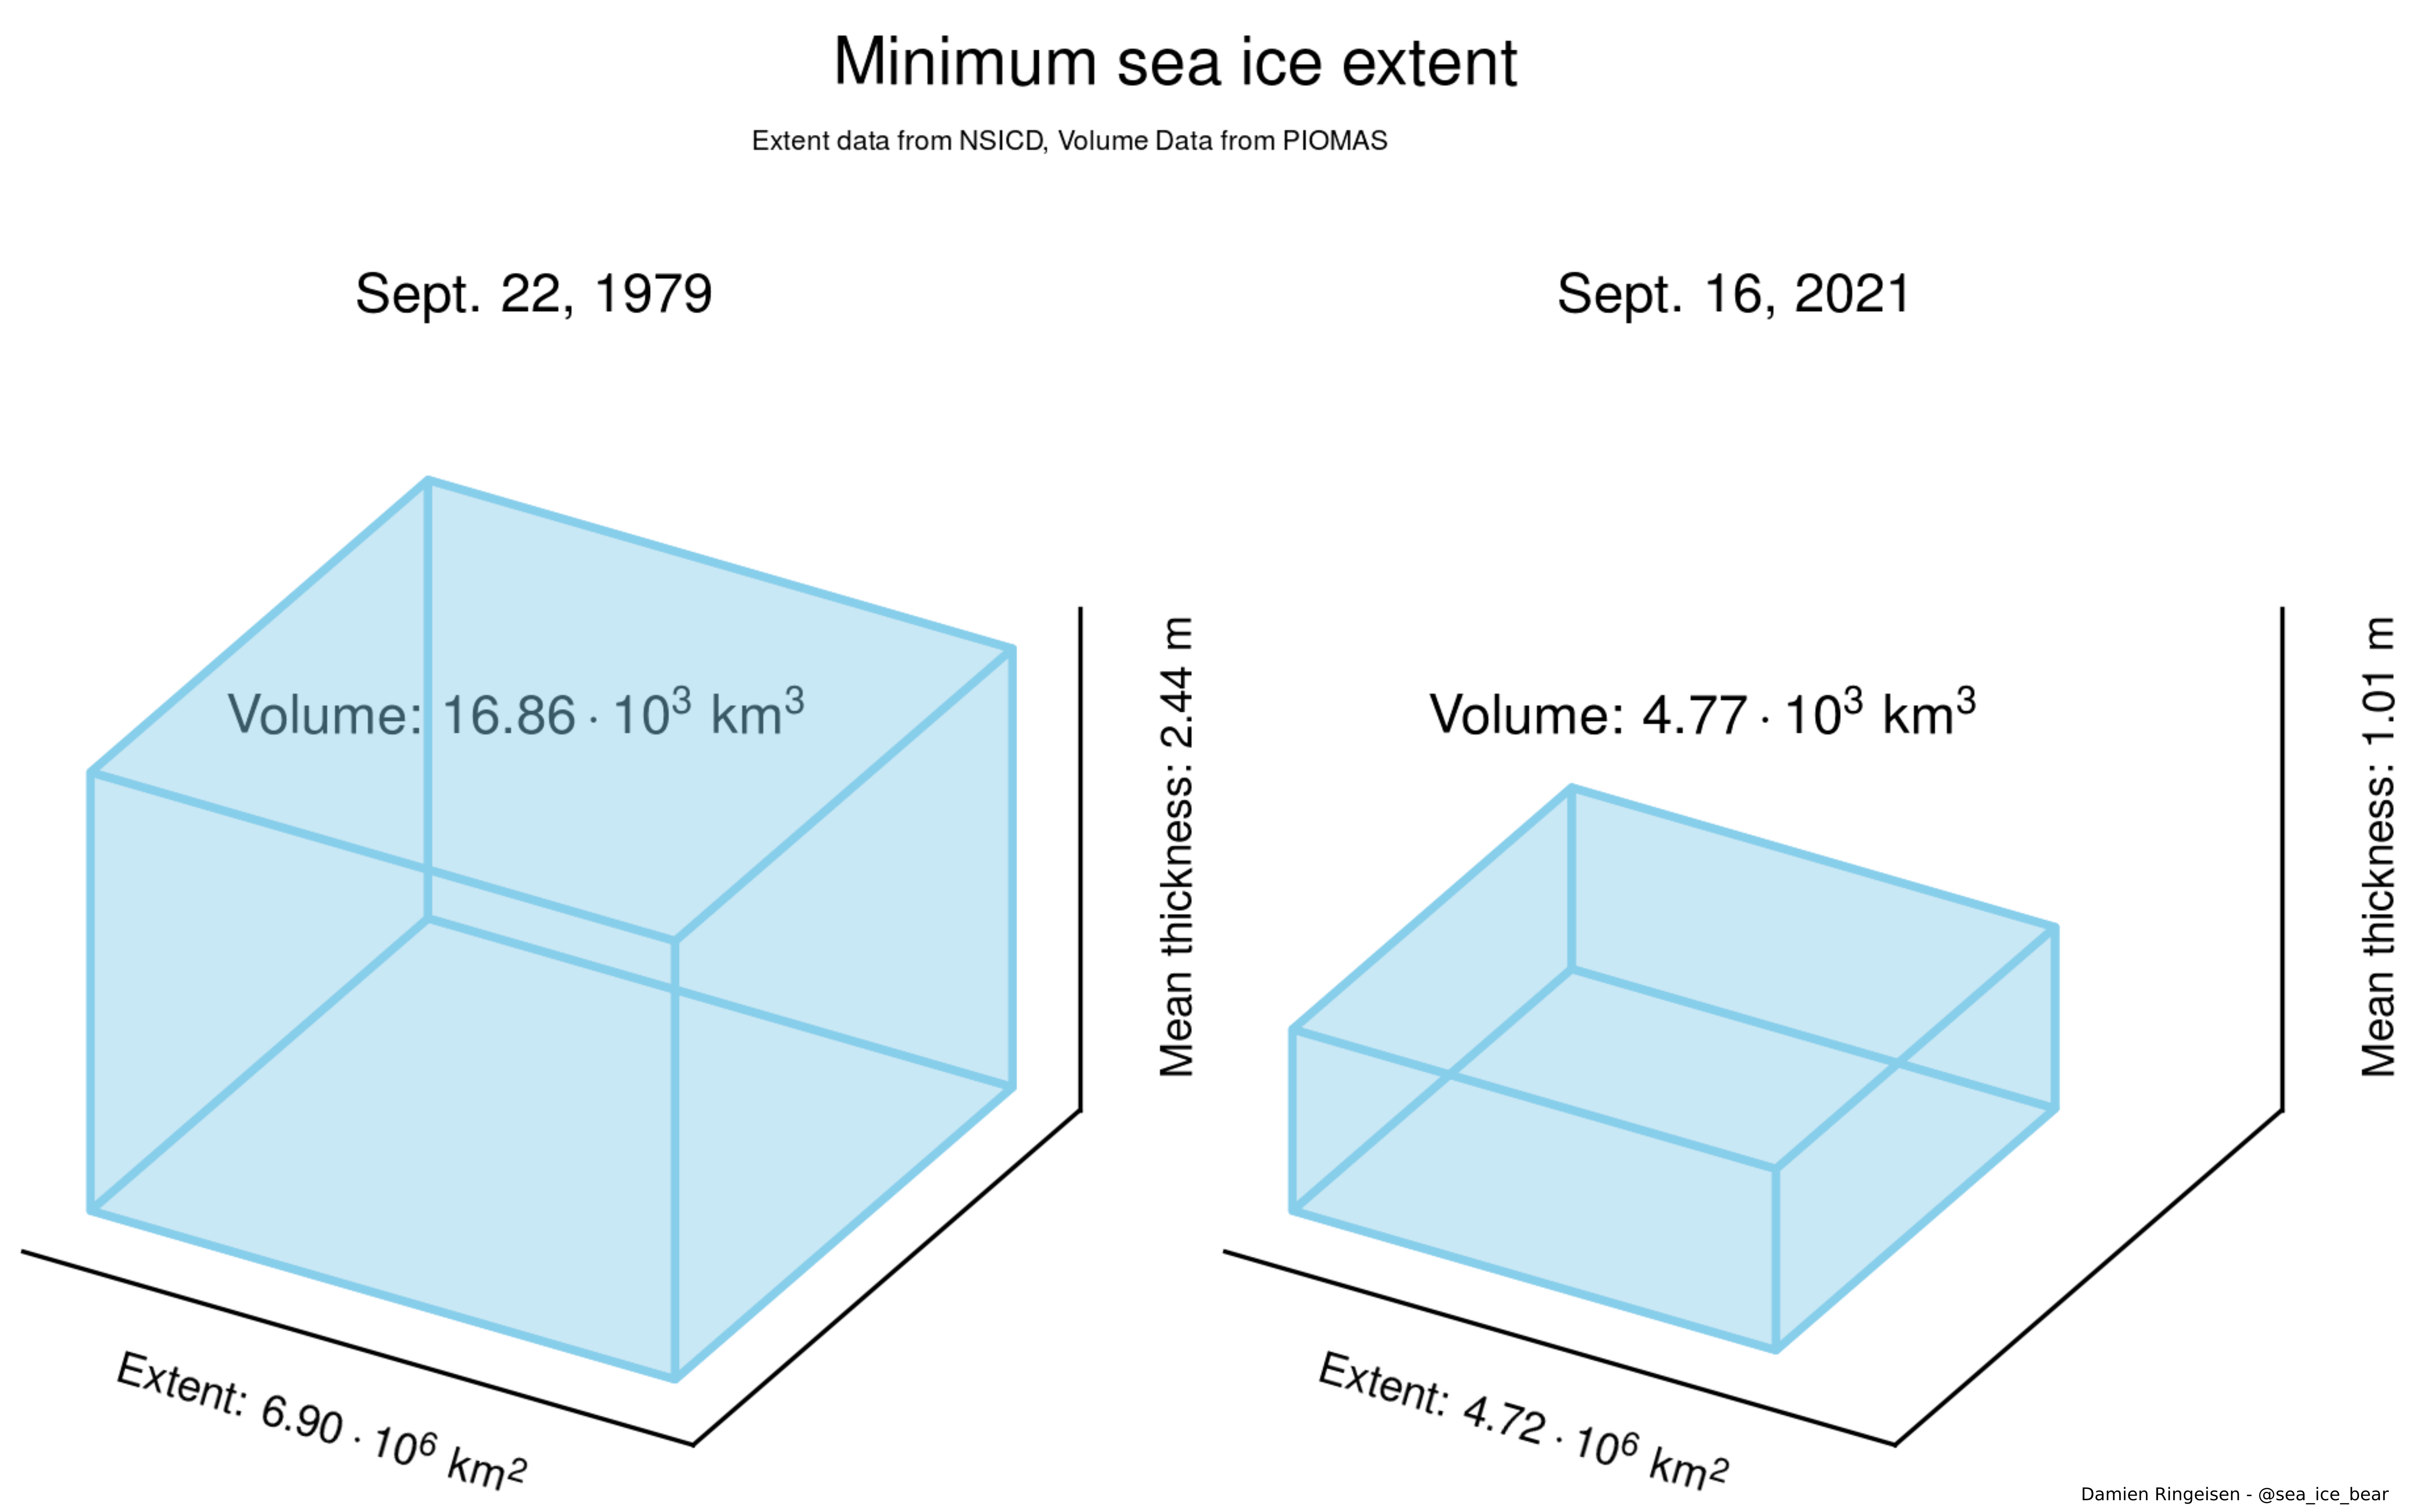
You can see how the 2021 ice cube is smaller than the 1979 ice cube in the horizontal (less sea ice extent) but mainly in the vertical (the average ice thickness dropped dramatically).
To better compare, we can put the 2021 ice cube inside the 1979 ice cube. The effect is even more flagrant.
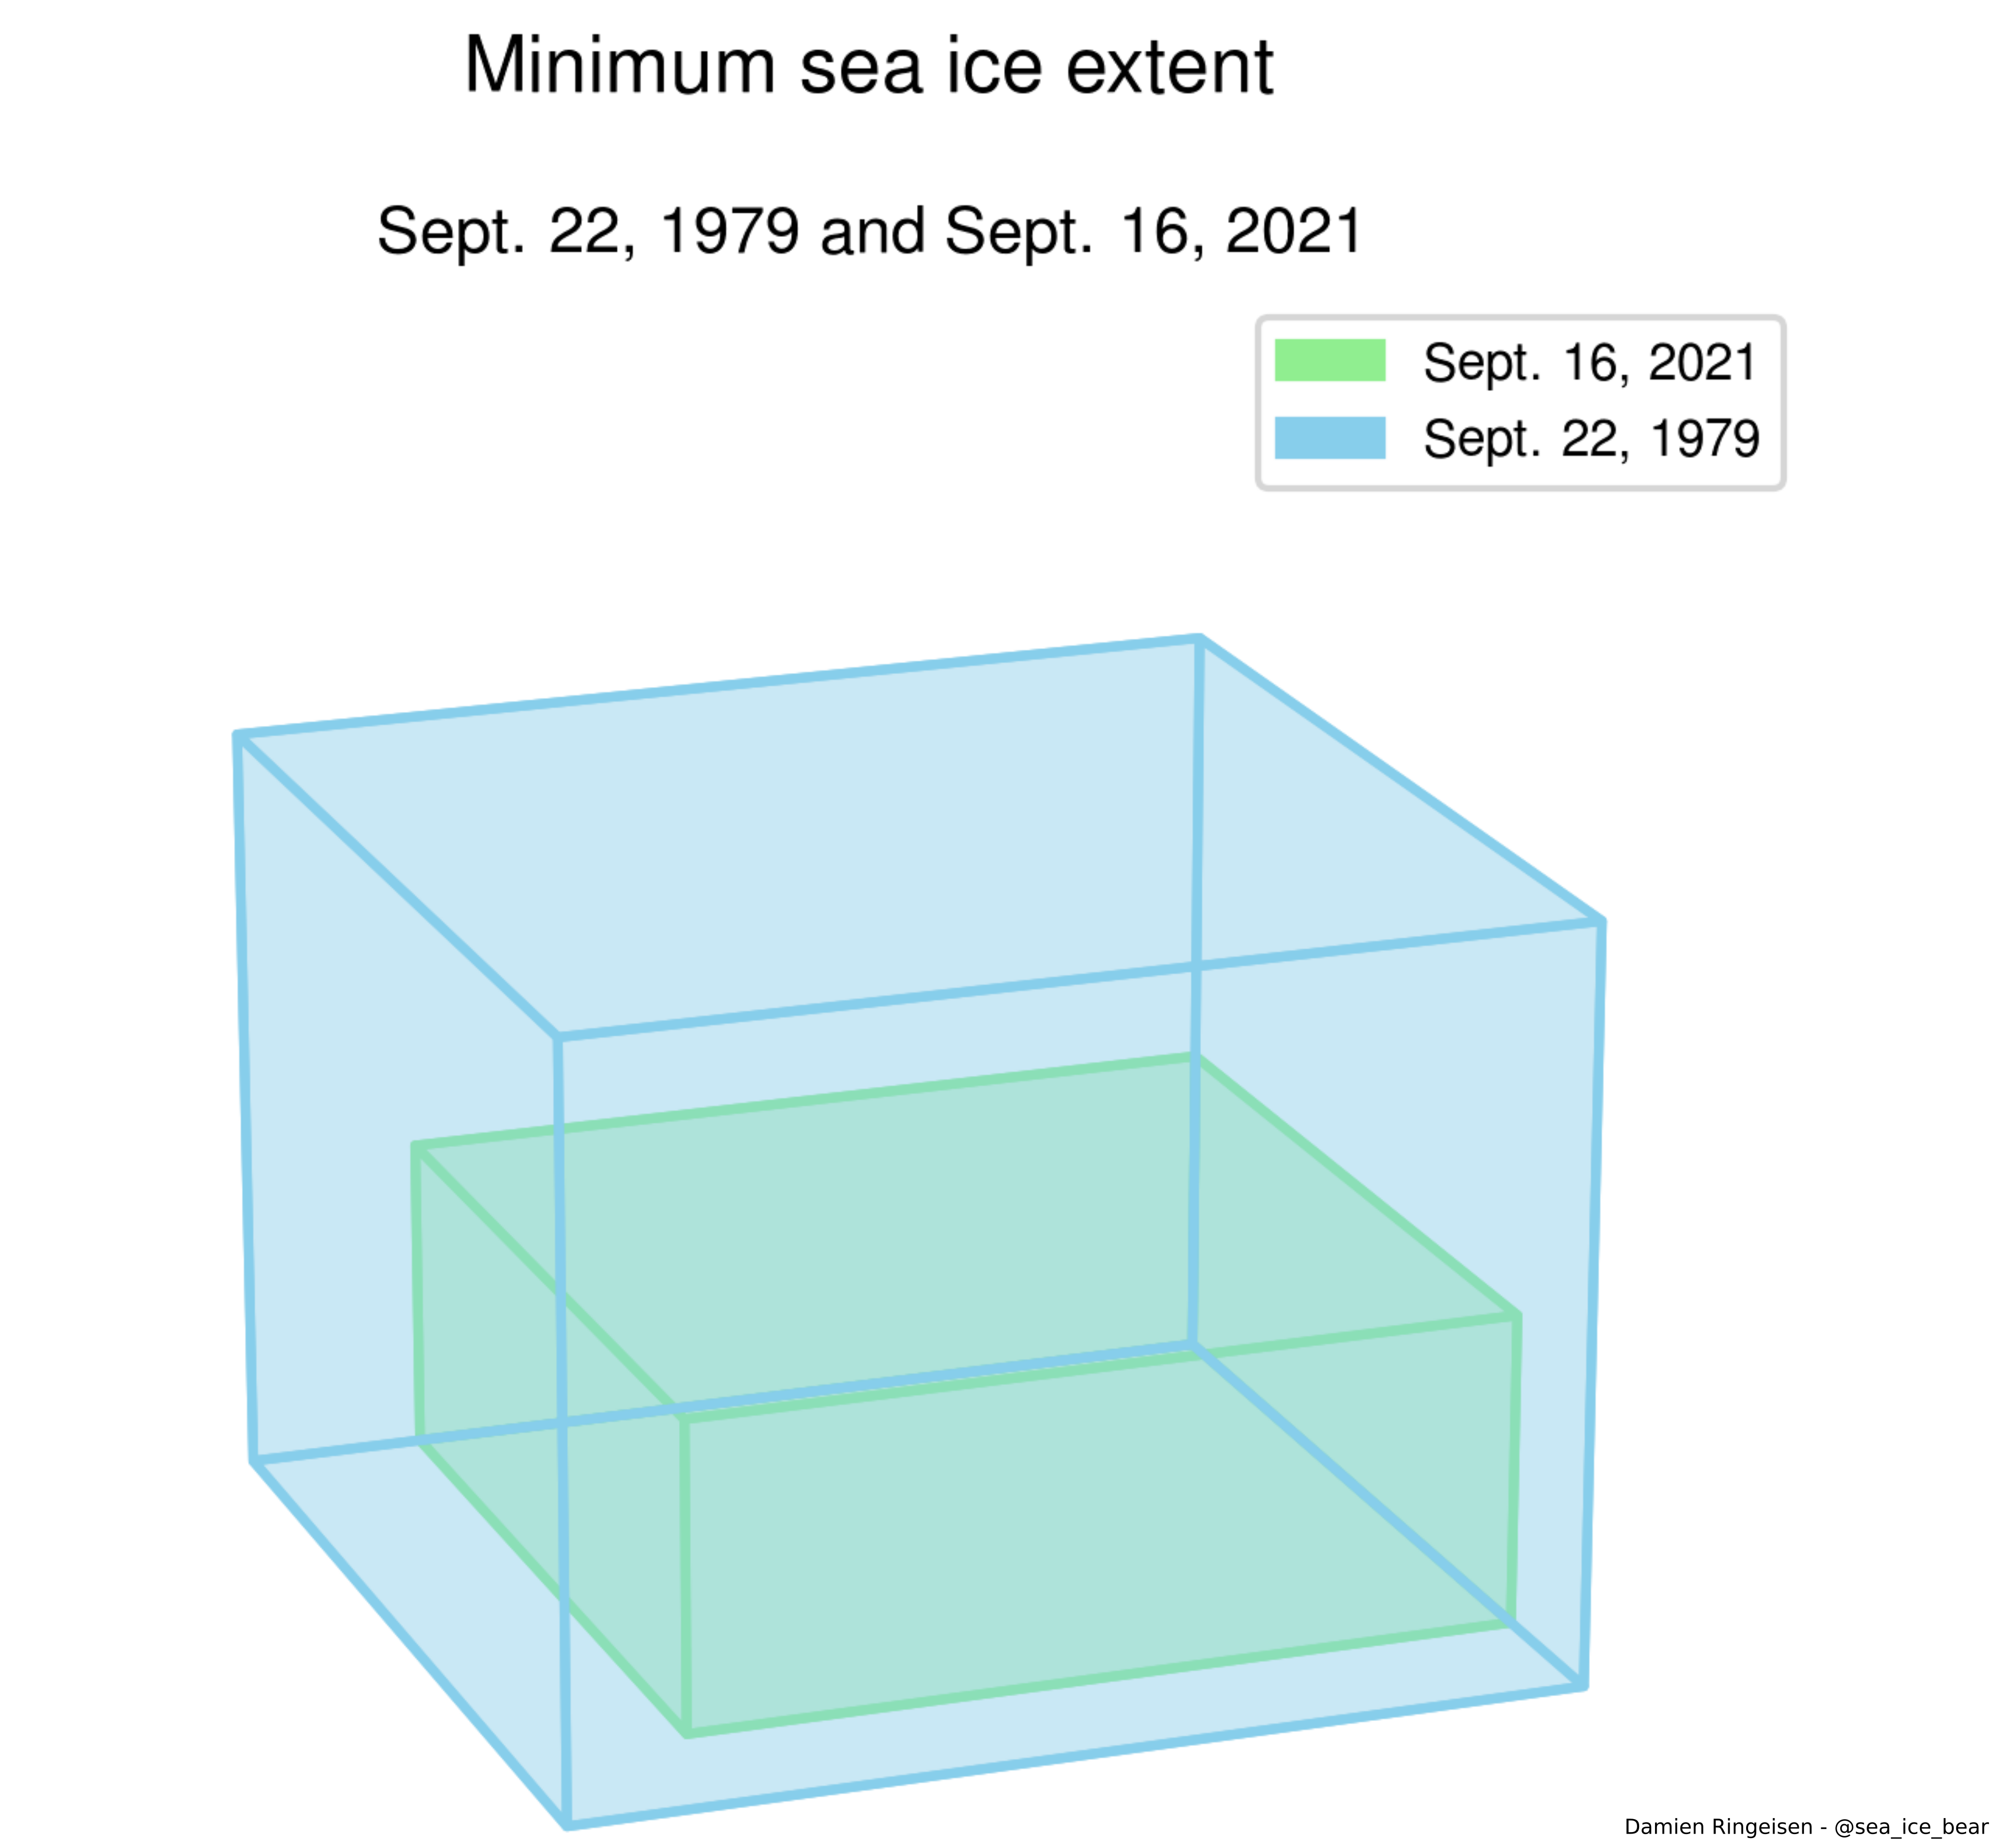
The Arctic sea ice lost:
- Almost 1/3 of the ice extent.
- Almost 3/4 of the sea ice volume.
- More than 1/2 of the average ice thickness.
So what happened? Due to climate change, the Arctic lost its old thick ice. What is old ice? If a piece of sea ice survives the minimum sea ice extent, it becomes one year older, and with every year, it becomes thicker. We lost most of the thick ice older than 4 years.
The warmer Arctic we know today cannot form such old ice because very little ice survives until the following year. Today, young ice is too thin to survive the hotter summer. Watch this video to see the decline of old ice.
We could compare more years or decades, but the results would be mostly the same.
I hope that helped to understand how dramatically climate change impacts the Arctic. Science is here, and we need some Climate Action Now. Do not put your head in the snow like a hunting fox.

Now is the time to act.
Thanks for reading until the end, and I hope this was interesting! Let us know what you think in a comment or on Twitter.

This work is licensed under a Creative Commons Attribution-ShareAlike 4.0 International License.