This is post 3/3 in a series on our experiences and tasks as ArcTrain PhD students during the research cruise M164 (GPF 19-1-105) in summer 2020 in the subpolar North Atlantic. Click here to see part 1/3 and here to see part 2/3.
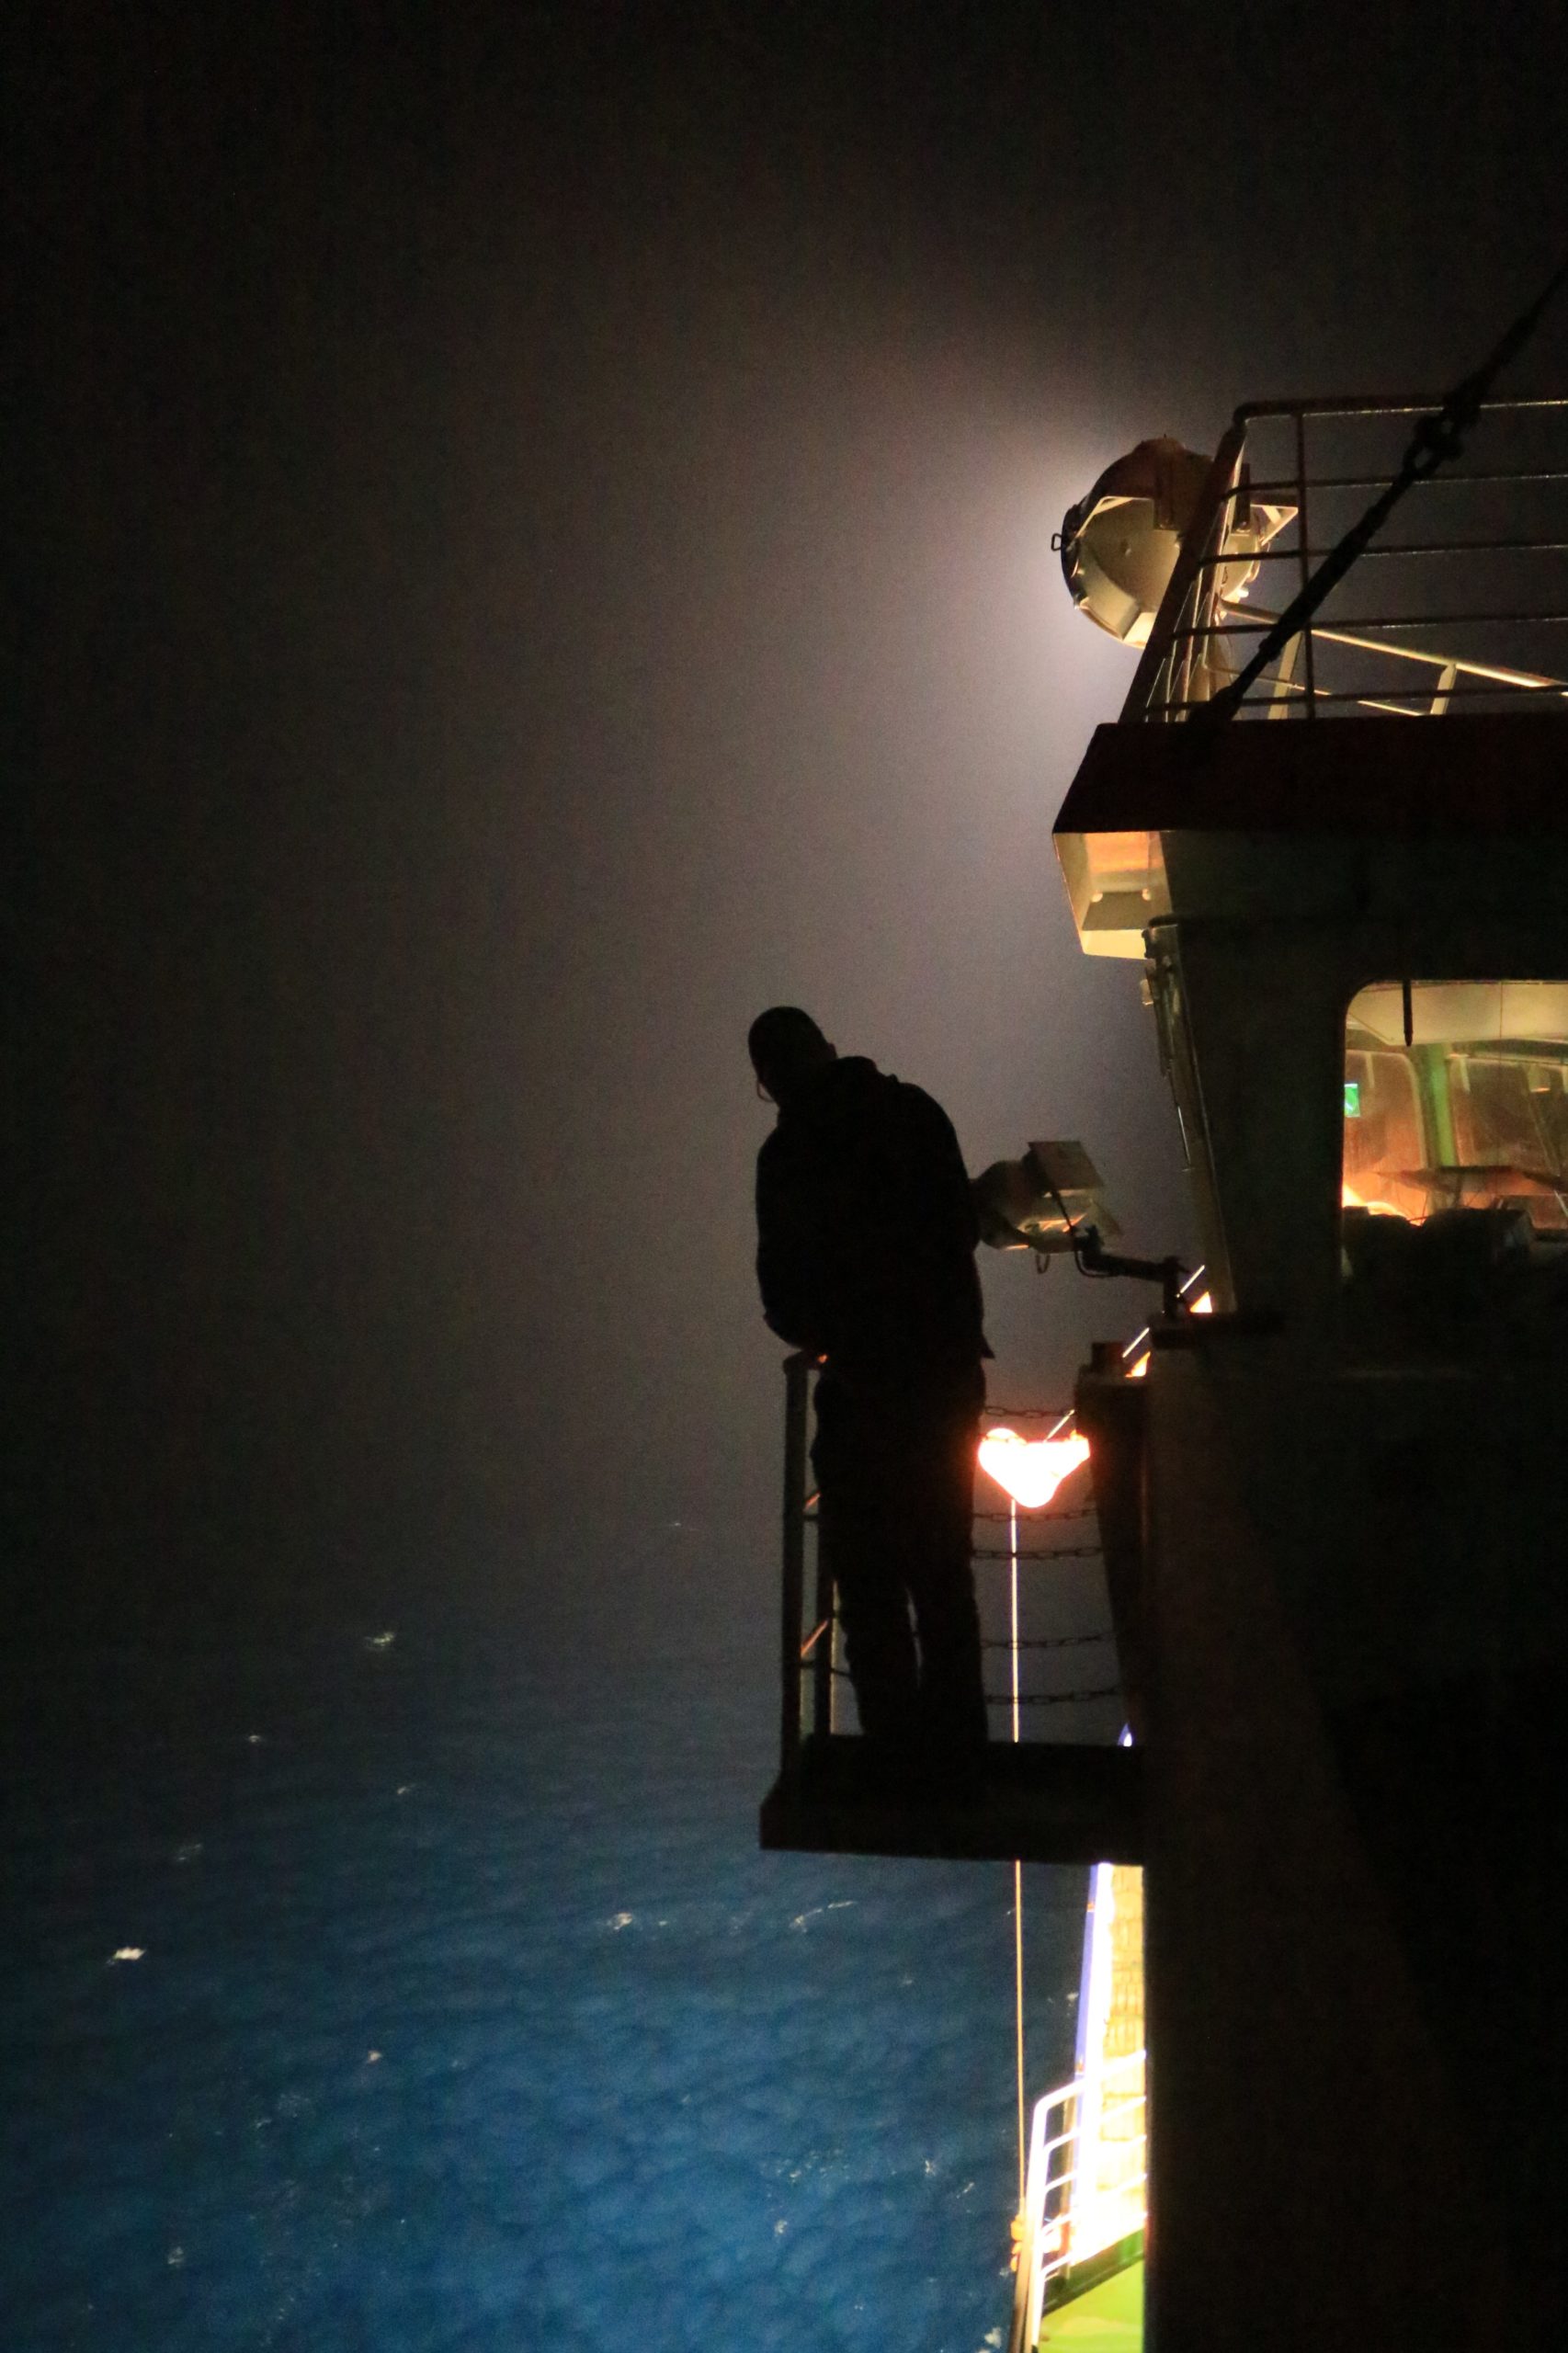
It’s just after midnight. Around the ship, there is darkness everywhere, and fog is gathering. Several people are on the ship’s bridge, waiting for a flashing light to pop up in this quiet night in what feels like the endless expanse of the North Atlantic. Two people are standing on the cold and windy top deck to receive a radio signal from our Pressure Inverted Echo Sounder (PIES) instrument as soon as it reaches the surface (See our last blog post from Simon to get to know the PIES). It could break through the ocean surface anywhere, as far as the eye can see and beyond. But while others are staring into the dark night, I am sitting in front of a computer monitor watching live data of the North Atlantic Current, as the extension of the Gulf Stream in the North Atlantic ocean is called, roaring underneath the ship. At our position, the North Atlantic Current points to the north-east with a velocity of one meter per second. I forward the information to the bridge and I can feel the ship changing position, and a slight rolling sets in. The device that everybody is waiting for was sitting on the ocean floor in a depth of roughly 4000 meters for over a year. As it is slowly rising towards the surface, we have to consider that it is moving with the ocean current underneath and might appear at a different position from where it was originally deployed.
The ship’s rolling has stopped, and the bow of the ship is now pointing towards the south-west exactly the opposite direction of the North Atlantic Current at our position. If the velocity data that I see on the monitor are correct, the measuring device is supposed to show up just ahead of the ship in only a small distance and will be drifting with the current towards our ship. The intercom of the ship buzzes, and I can hear the voice of the officer on duty “Contact, directly ahead. Distance, one mile.” The current transported the device just where I assumed it to be. This was the last of the eight devices we had planned to pick up during this research cruise. All recoveries have been successful not least due to our live monitoring of the ocean current underneath the ship to predict their position when reaching the surface. But how can we measure the ocean currents at all, and why is it so important for all of us?
Benjamin Franklin, one of the Founding Fathers of the United States, writer, philosopher, politician, and diplomat also was a scientist. And within his role as a scientist he is connected to one of the major topics that climate scientists still investigate today: the Gulf Stream and the North Atlantic Current, first charted by Benjamin Franklin and his cousin Timothy Folger in 1769. (Follow this link to the Franklin-Folger map of the Gulf Stream.) Today, we know that this chart of the Gulf Stream shows only one part of the current system. Franklin sketched the ocean current as a narrowly bounded feature reaching into the center of the North Atlantic. In the center of the North Atlantic, the ocean current is less confined but meanders and stretches over a larger distance, the current is not called Gulf Stream anymore but North Atlantic Current. It transports warm and saline water from the subtropical North Atlantic into the north-eastern part of the Atlantic and even into the Arctic Ocean. Along its way it releases heat to the atmosphere and is therefore one of the main reasons for the mild climate in Europe, which leads to a completely different climate in Paris and Newfoundland, for example, although both are roughly at the same latitude.
But if water was only transported northward, the sea level would rise in the northern part of the Atlantic and fall in the southern part. To compensate for the northward transport of the North Atlantic Current, there is also a current transporting water southward. At the western boundary of the Atlantic, water is transported southward, within the Labrador Current and the Deep Western Boundary Current. North Atlantic Current, Labrador Current, and Deep Western Boundary Current are part of the global ocean circulation that redistributes heat all over the world ocean.
To measure and understand the northward flowing North Atlantic Current and the southward flowing Deep Western Boundary Current is one of the goals of the research cruise M164 (GPF 19-1-105) aboard the German research vessel Meteor where I was able to participate as part of my PhD training within the International Research Training Group ArcTrain. In summer 2020 we crossed the Atlantic Ocean from east to west (and back again) at the approximate latitude of Paris in Europe and Newfoundland in North America (~47°N).
Franklin’s research was based on observations from seafarers who used knowledge about the surface currents for being faster on their way from the east coast of North America to Europe. The Gulf Stream and the North Atlantic Current are such surface currents.Today, the strength of an ocean current is not estimated from different ship velocities anymore but with an instrument called Acoustic Doppler Current Profilers (ADCP). ADCPs measure the ocean currents via the Doppler effect. One famous example for the Doppler effect is an ambulance with the siren switched on. If the ambulance comes closer towards you, the sound of the siren has a higher frequency (the sound waves are squeezed), when the ambulance moves away from you, the sound of the siren has a lower frequency (the sound waves are stretched). As a result, there is a shift in the frequency, and this Doppler shift is exploited when using ADCPs. The ADCP transmits an acoustic signal, a ping with a defined frequency. This signal is reflected from tiny particles in the water drifting passively with the ocean current. Receiving the echo of the reflected ping, the ocean current velocity can be calculated from the Doppler-shifted frequency.

During our research cruise we used the ADCPs with two different setups working in parallel. We had two ADCPs mounted right in the hull of the ship (and yes, when the instruments are removed there is a hole in the ship’s hull, so be careful). Additionally, we used a system of two ADCPs that, together with the large water sampler system, are lowered down to a few meters above the ocean floor. One device looks downward and the other one upward. In this way we get a vertical profile of horizontal velocities The ADCPs mounted directly in the ship’s hull provide data of the current speed at any time during the research cruise but are limited in their vertical range and cannot measure beyond a certain depth (700-1200 meters maximum). The lowered ADCPs (lADCPs) measure a continuous profile of the currents in the ocean, from the surface to the ocean floor.
My task during the research cruise was to ensure that the system of the two lowered ADCPs was successfully operated and delivered high-quality data. This involved changing the batteries of the device after a certain runtime, regularly inspecting all the electronic cables, processing all the obtained raw data and identifying any failures that needed to be fixed right away. To have a first look at the velocity structure along our track, I visualized the obtained and processed data. In addition, as described above, I analyzed the direction and strength of the ocean current as it prevailed during the recovery activities of various instruments. This helped to better predict the position of these instruments when they reached the ocean surface.
In total, we lowered the water sampler system including the lADCPs 126 times during our research cruise. We were able to identify the North Atlantic Current, the extension of Franklin’s Gulf Stream in the North Atlantic, transporting warm and saline water to the northeast and the Deep Western Boundary Current transporting cold and fresh water to the south. With the knowledge of the velocities and the exact directions of the currents in the North Atlantic, colleagues from my working group can calculate the total transport of volume, heat, and salt. These measurements are important, especially in times of climate change, and serve as an important reference for projecting the future of the North Atlantic and the entire world’s climate in ocean and climate models. But that is a different story.