Science for everyone

Ever thought science is complicated and you won’t understand it anyway? Let this section contradict you.


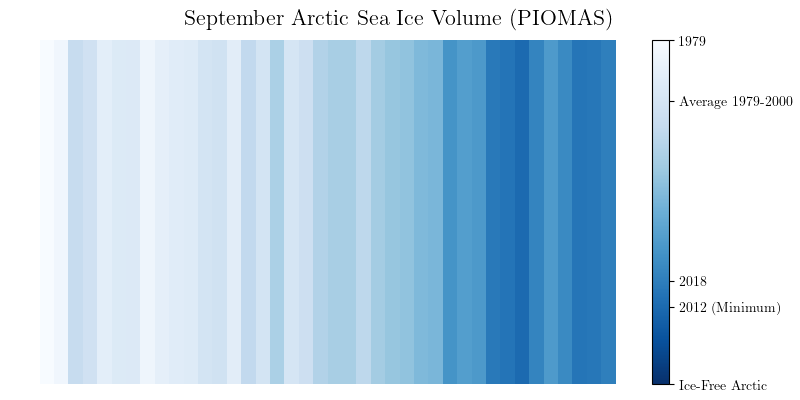
In this blog post, I (Damien Ringeisen) reshape a Twitter thread that I published on November 3rd, 2021. Today, as the COP26 started a few days ago, I would like to help you visualize the reduction of sea ice in the Arctic Ocean. For simplicity, we will compare two years: […]

Huge Melting Ice Cubes


You probably know the Climate Stripes. Yes, you know, the blue and red stripes representing the earth’s warming from human emissions. This powerful representation, invented by @EdHawkins, shows the average earth surface temperature change over the years. From blue to red, it demonstrates how the human greenhouse gas emissions increased […]

The Arctic Stripes