Science for everyone

Ever thought science is complicated and you won’t understand it anyway? Let this section contradict you.


In this blog post, I (Damien Ringeisen) reshape a Twitter thread that I published on November 3rd, 2021. Today, as the COP26 started a few days ago, I would like to help you visualize the reduction of sea ice in the Arctic Ocean. For simplicity, we will compare two years: […]

Huge Melting Ice Cubes


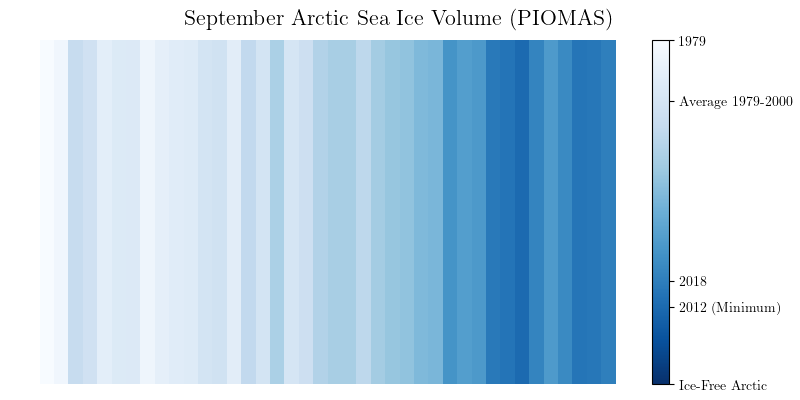
You probably know the Climate Stripes. Yes, you know, the blue and red stripes representing the earth’s warming from human emissions. This powerful representation, invented by @EdHawkins, shows the average earth surface temperature change over the years. From blue to red, it demonstrates how the human greenhouse gas emissions increased […]

The Arctic Stripes


Cela fait déjà quelques semaines que j’ai fêté le premier anniversaire de mon laboratoire à domicile. En effet, lorsque tout s’est éteint pour la première fois en mars 2020, je revenais d’un atelier éducatif dans le Nord. Pour cet atelier, je devais trimballer une loupe binoculaire dans mes bagages (un […]

Un atelier scolaire sur la paléontologie et l’évolution de la ...